Plotting depth and hypocenter results
Suppose we are running a grid search over both origins and moment tensor sources:
ds = grid_search(data, greens, misfit, origins, sources)
After the above command finishes, the data structure ds will contain all the moment tensors and corresponding misfit values.
Plotting misfit versus depth
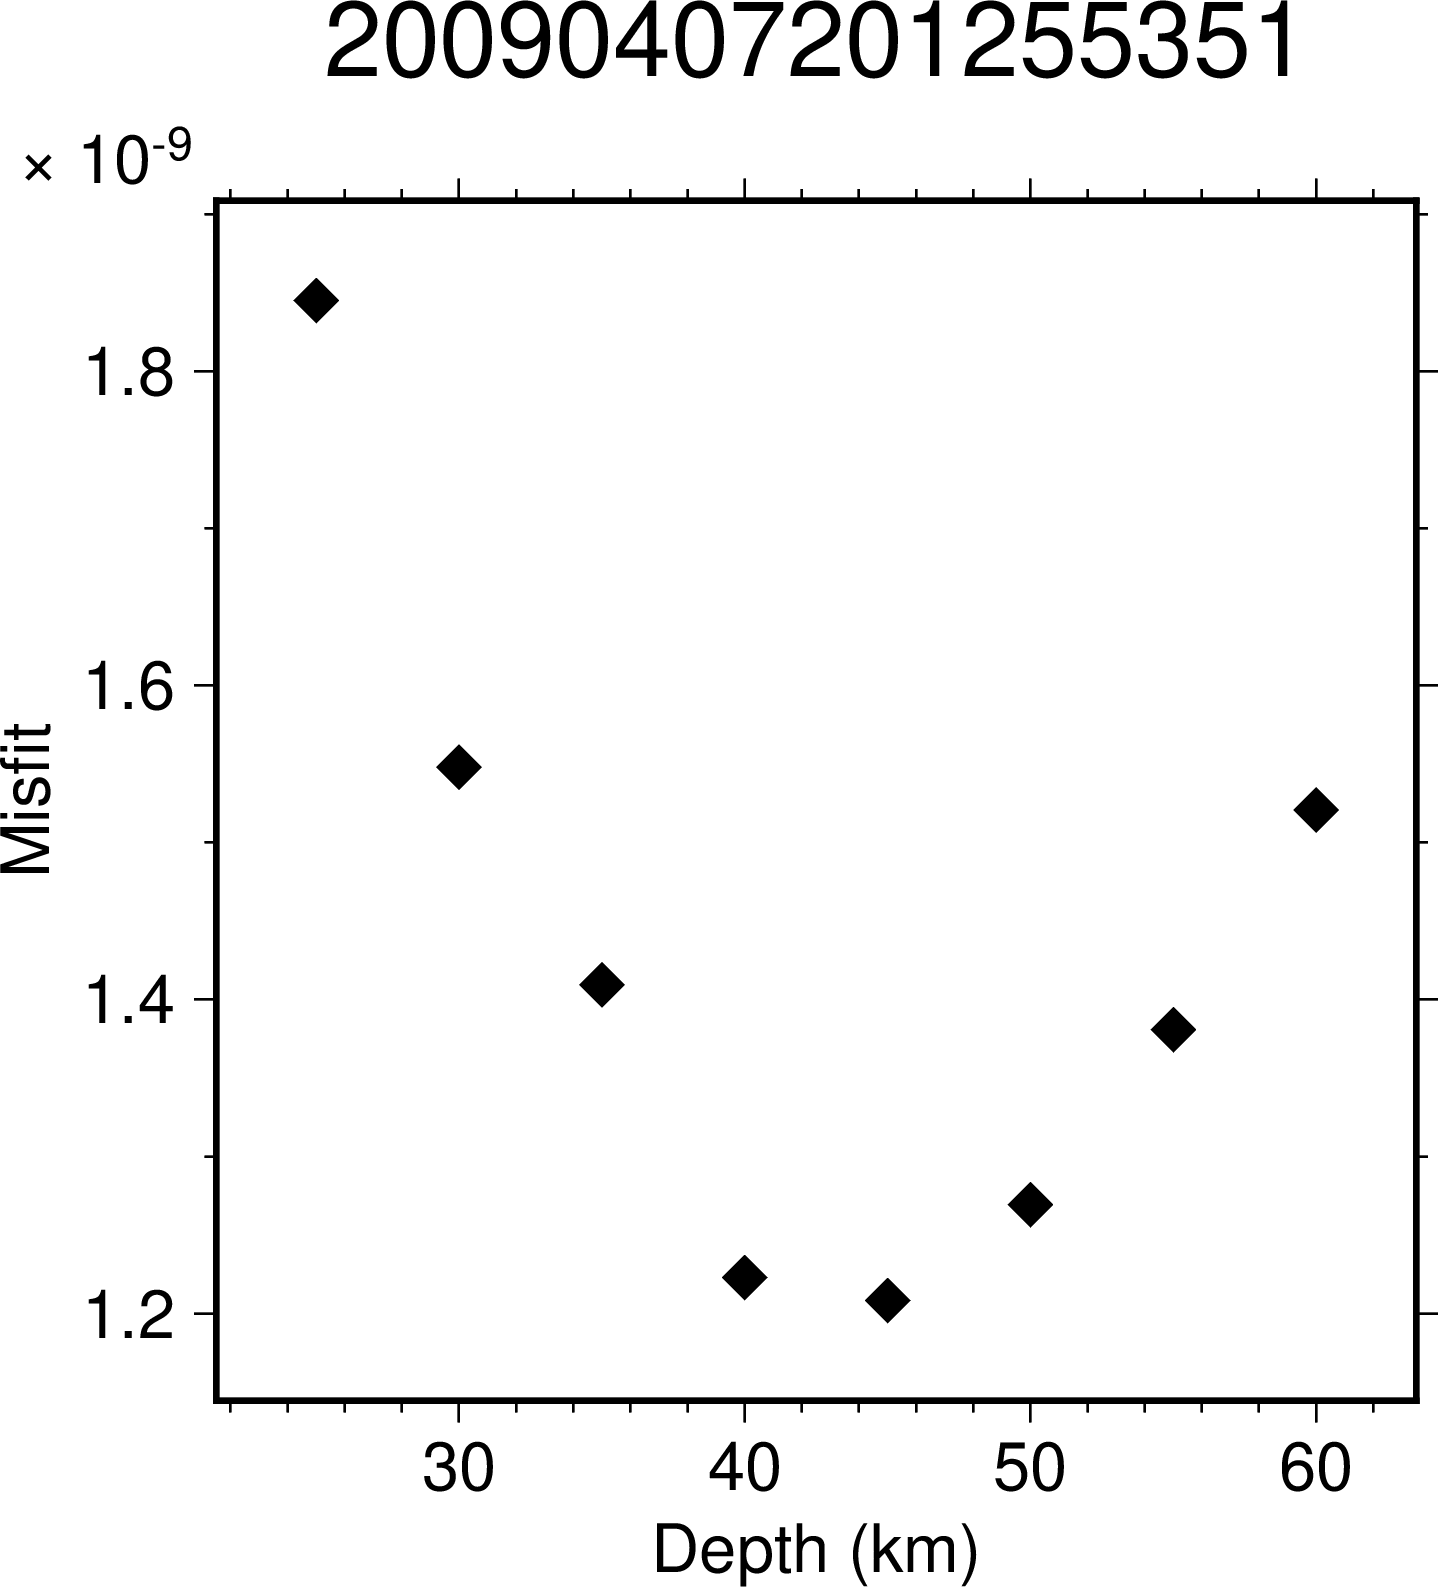
If origins represents different depths, we can plot the results as follows:
from mtuq.graphics import plot_misfit_depth
plot_misfit_depth(filename, ds, origins)

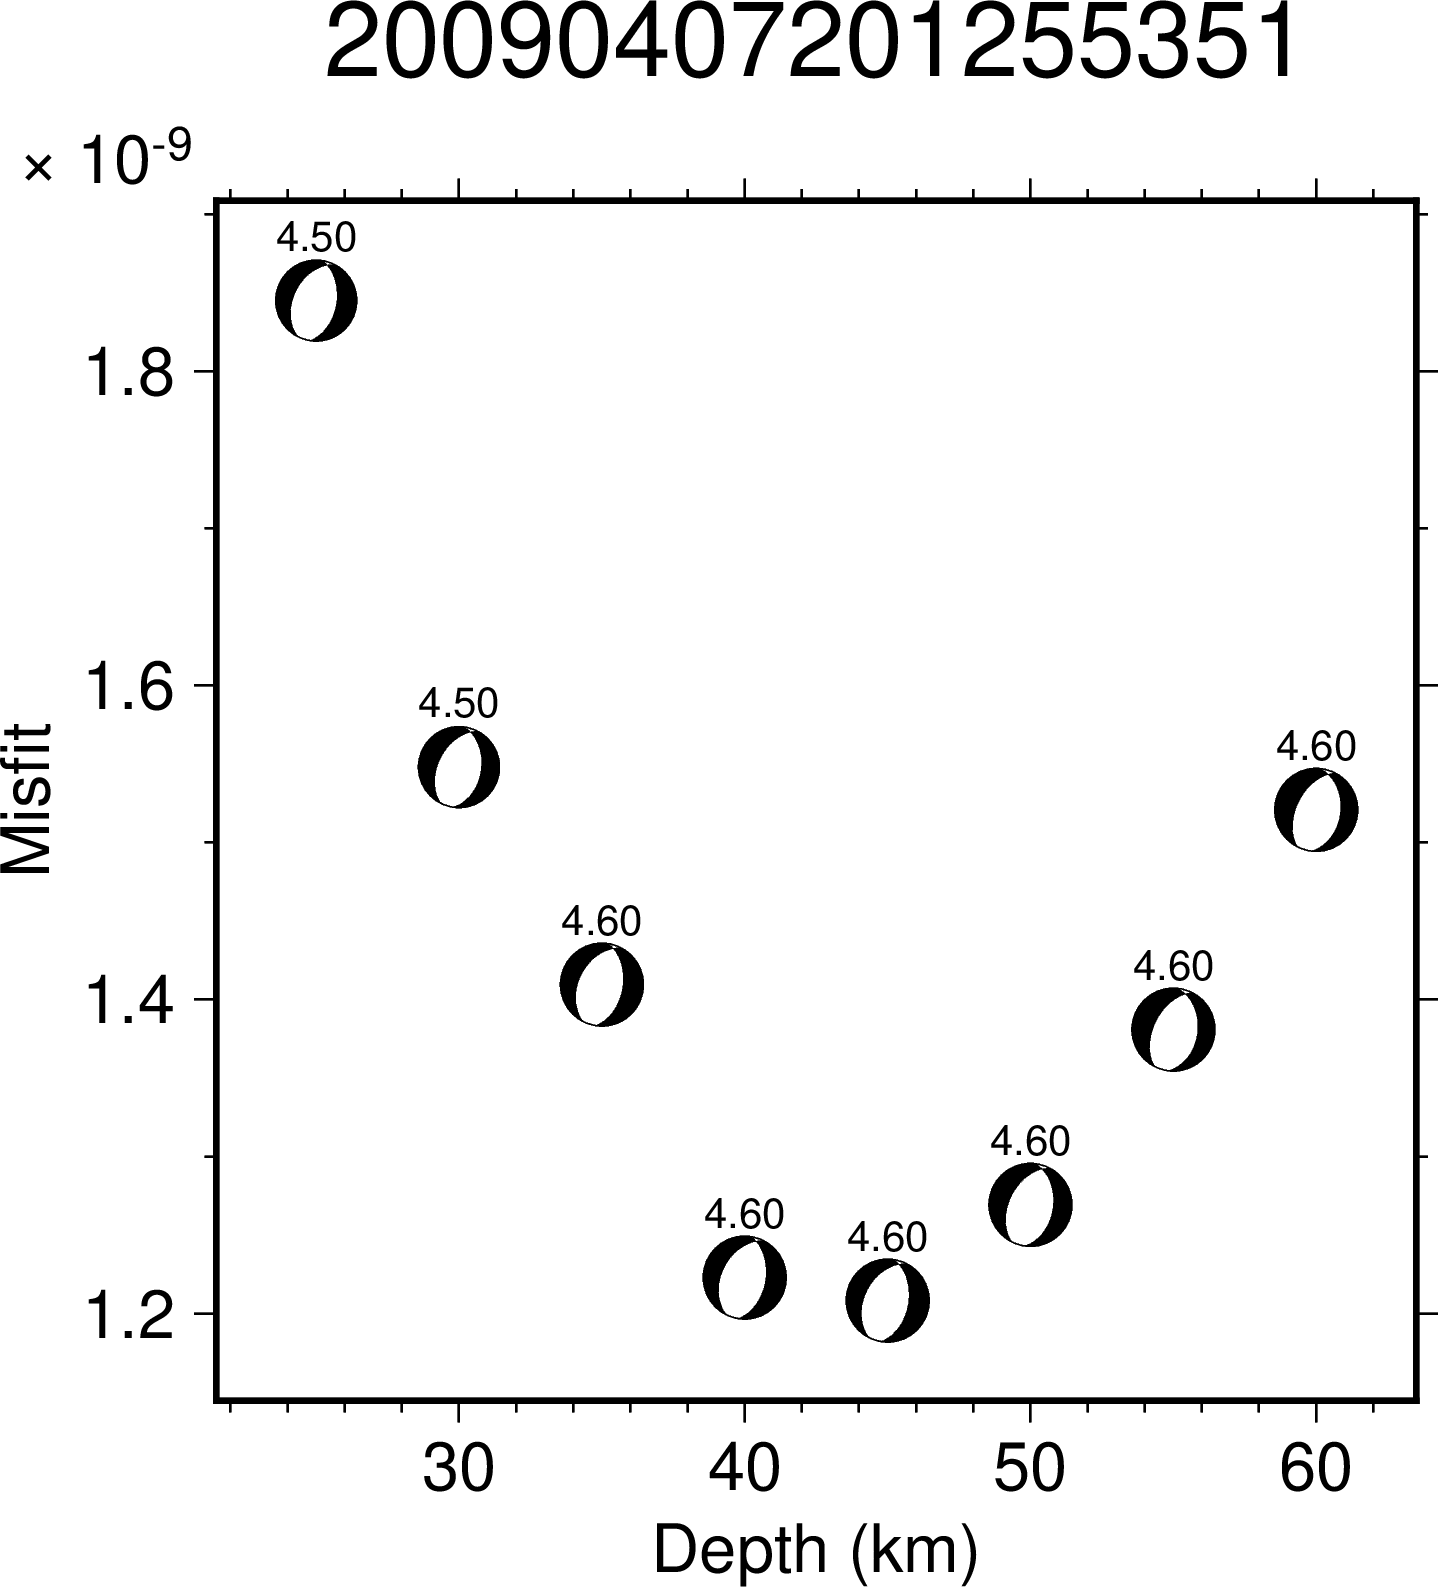
Tradeoffs with depth
To display tradeoffs with depth, we can add the following keyword arguments:
plot_misfit_depth(filename, ds, origins, show_tradeoffs=True, show_magnitudes=True)

Plotting misfit versus hypocenter
Warning
1D Green’s functions are used for the hypocenter grid search example.
(3D Green’s functions would provide more meaningful results, but are too large for remote hosting.)
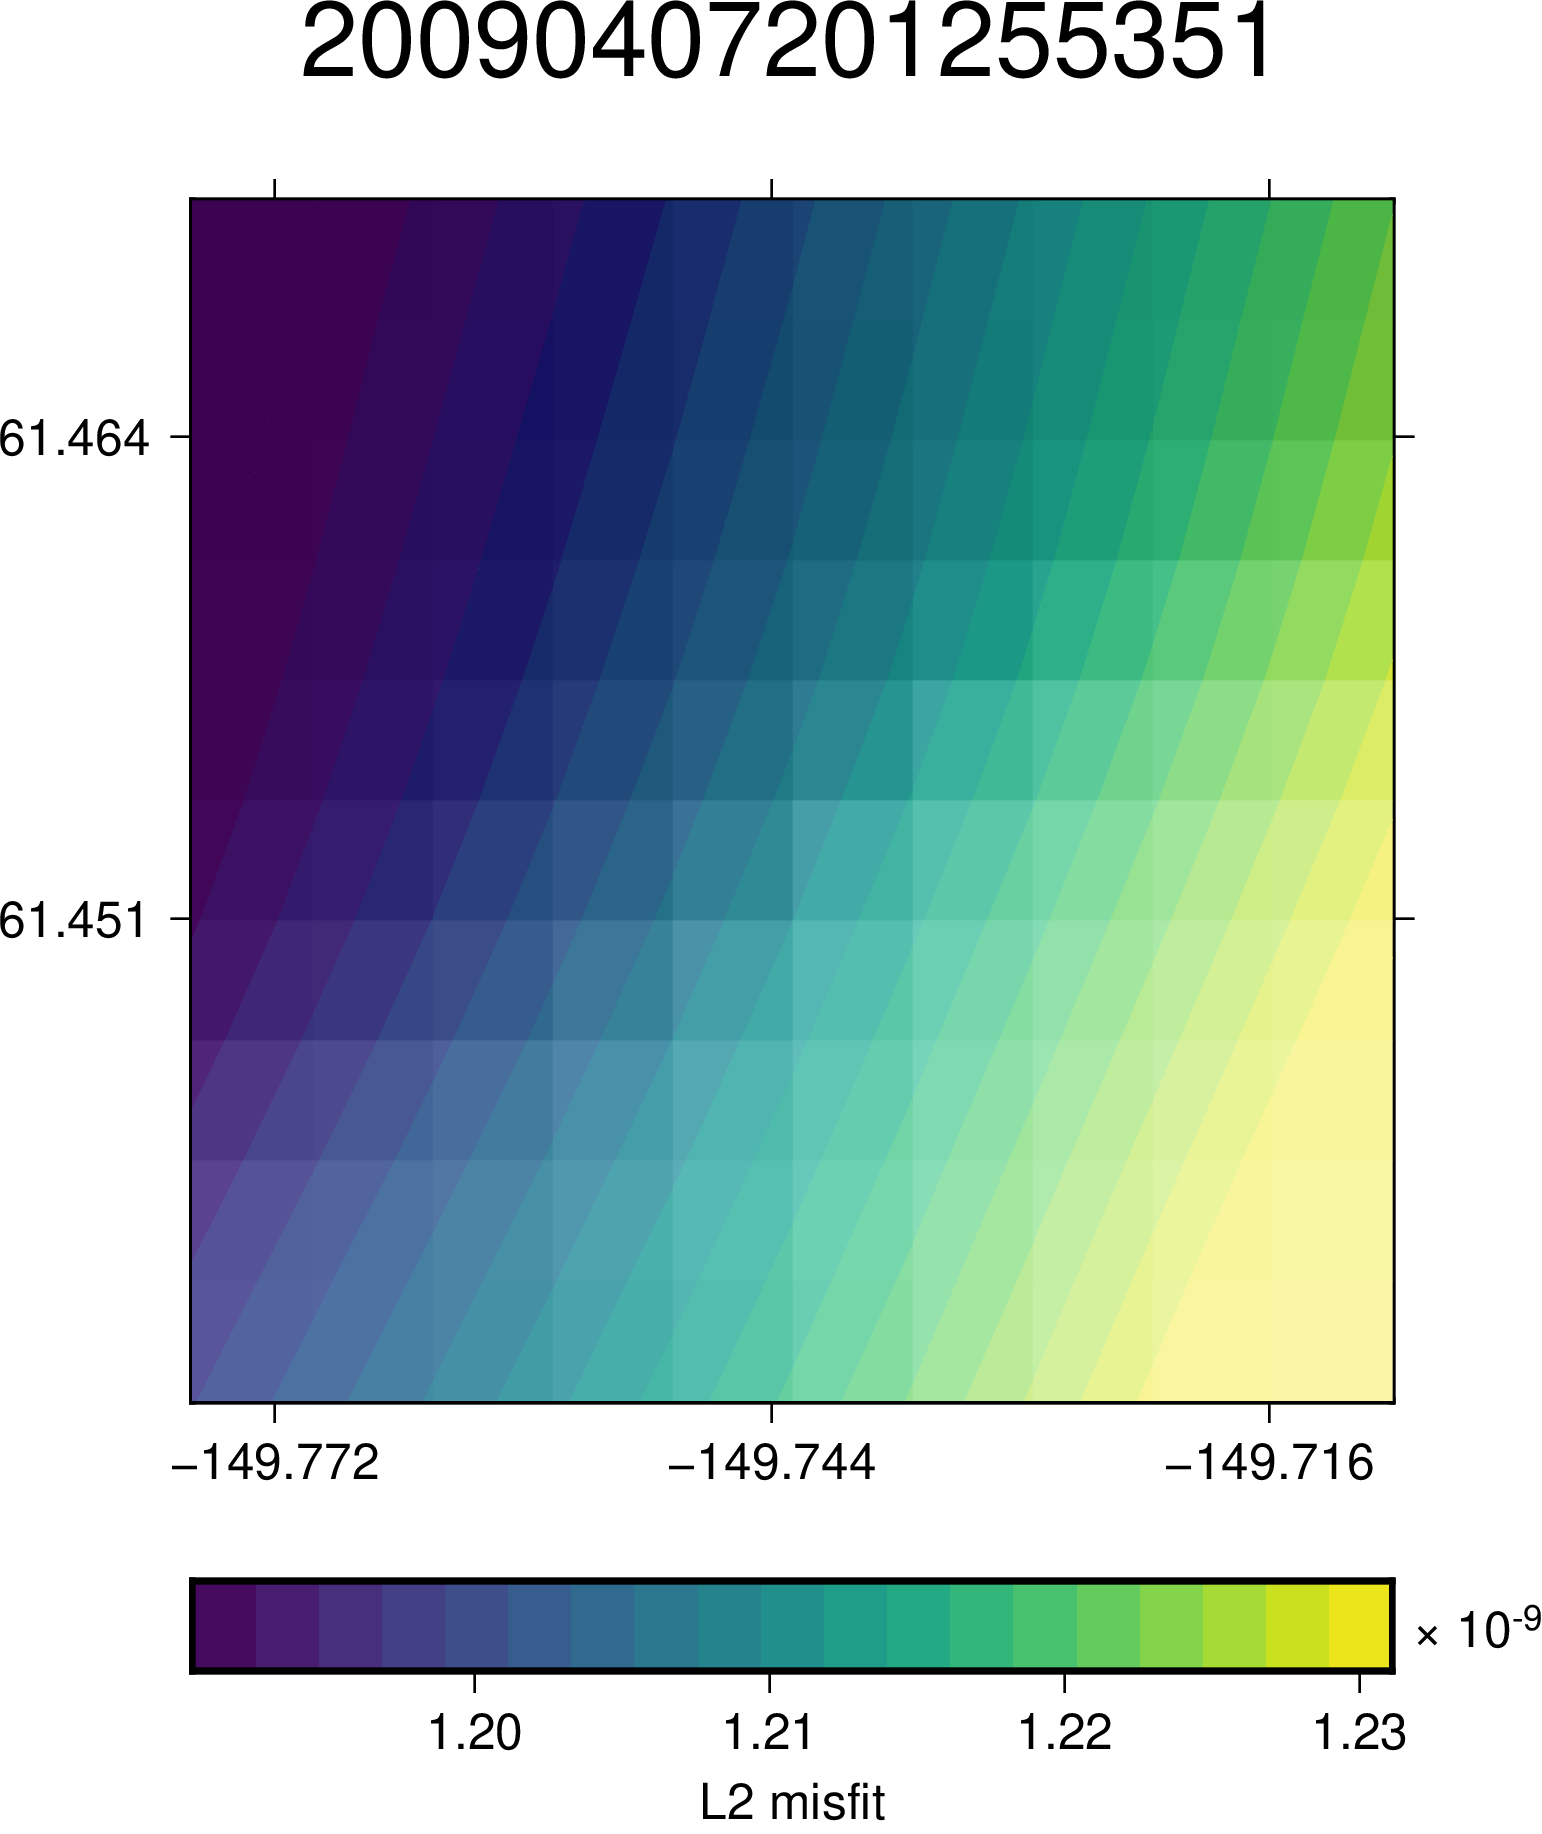
If origins represents different hypocenters, we can plot the results as follows:
from mtuq.graphics import plot_misfit_latlon
plot_misfit_latlon(filename, ds, origins)

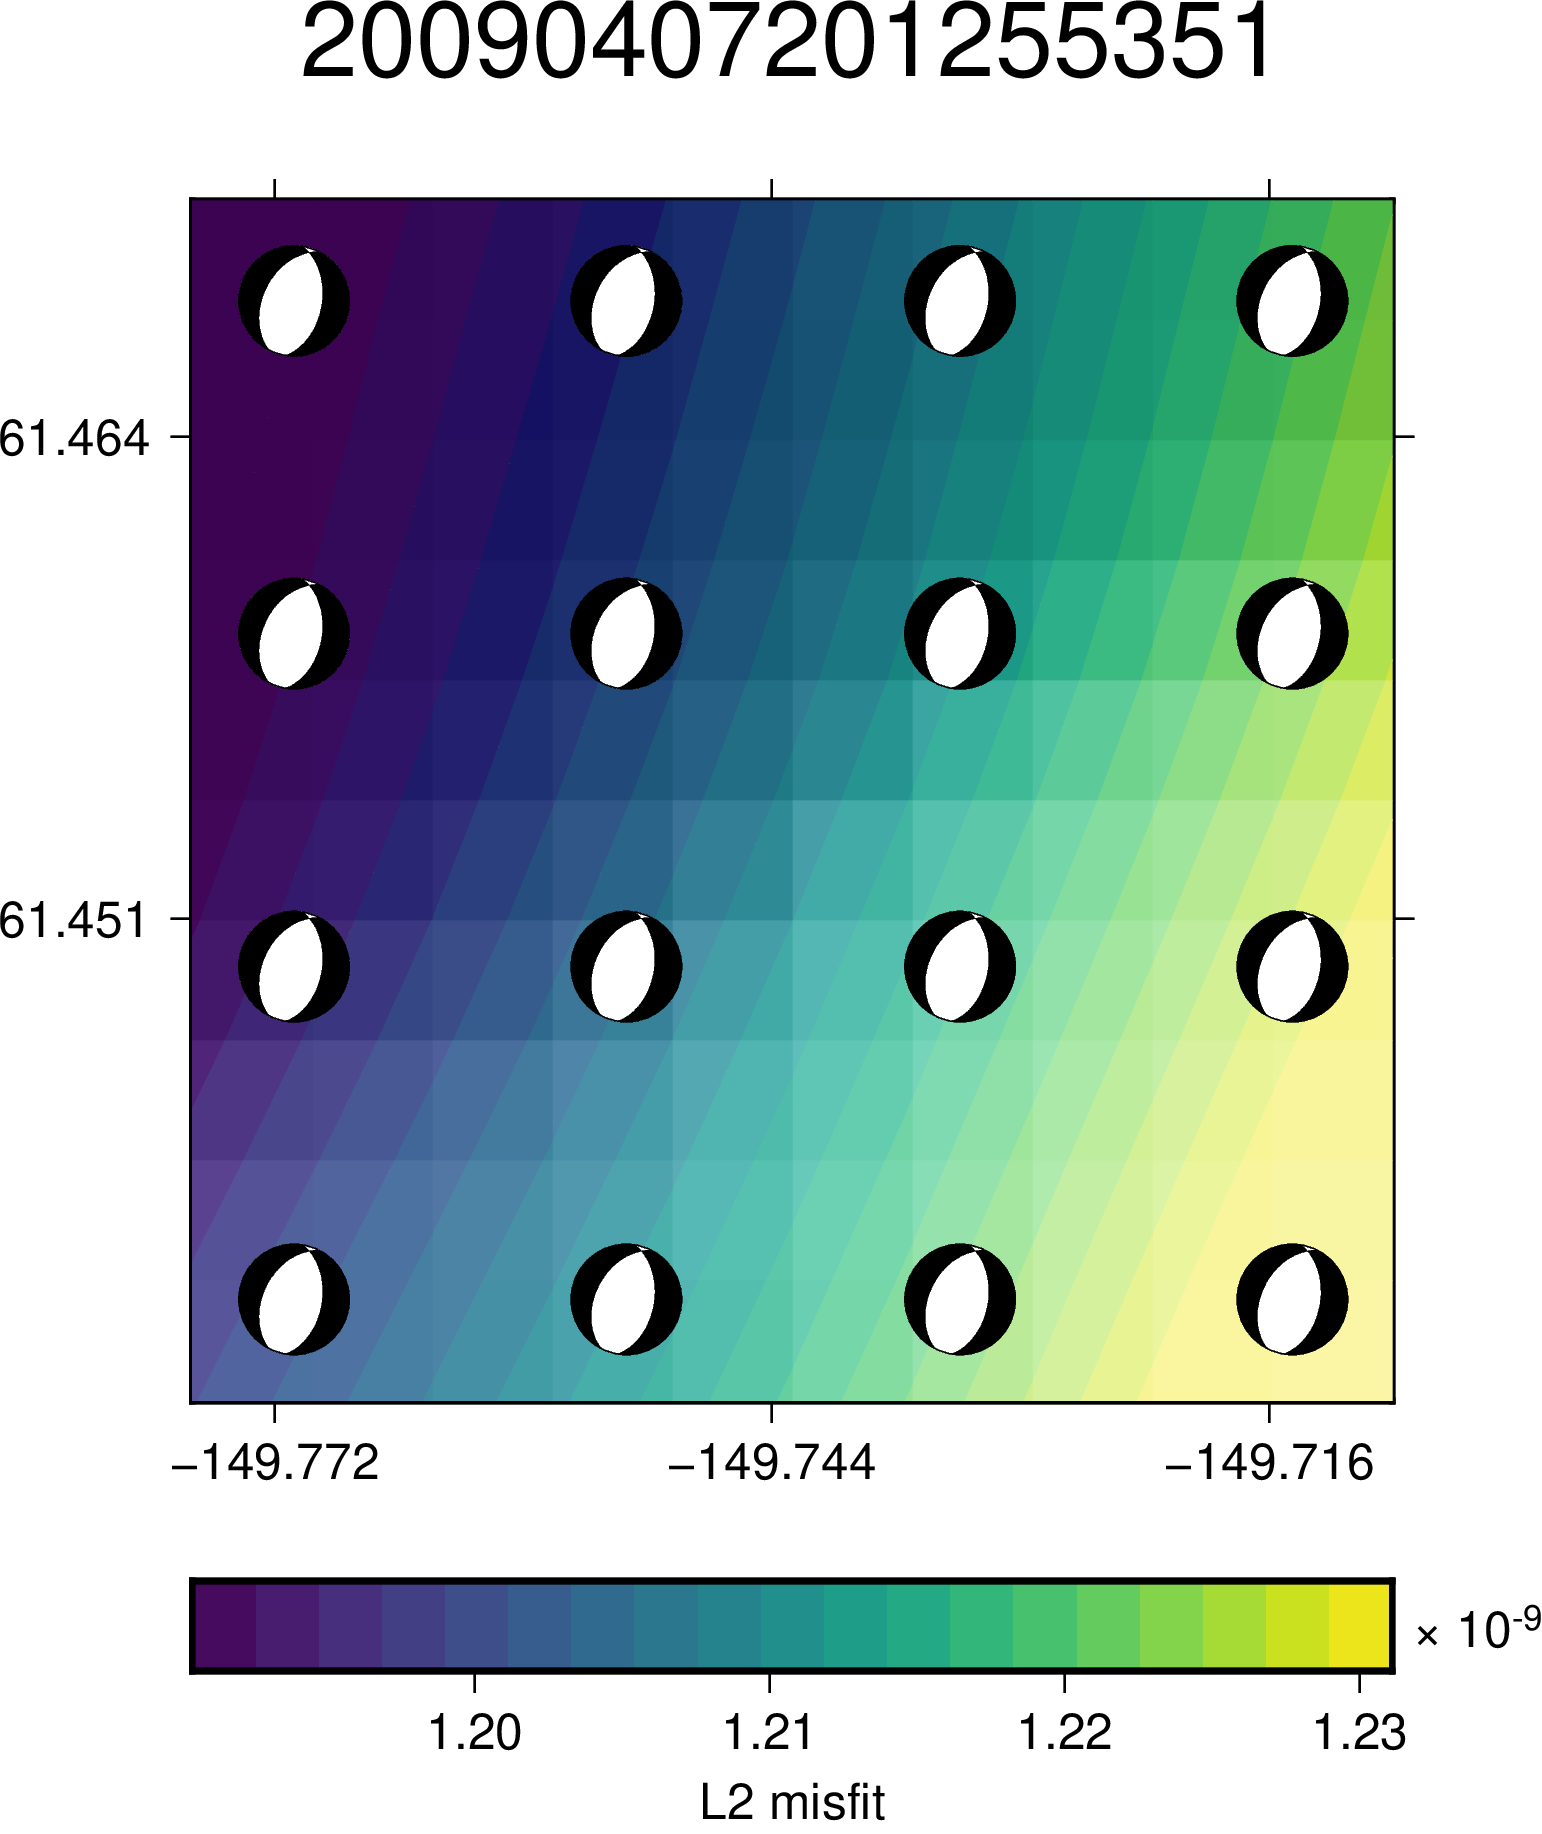
Tradeoffs with hypocenter
Warning
1D Green’s functions are used for the hypocenter grid search example.
(3D Green’s functions would provide more meaningful results, but are too large for remote hosting.)
To see how orientation trade offs with hypocenter, we can add the following keyword argument:
plot_misfit_latlon(filename, ds, origins, show_tradeoffs=True)

Source code
The above figures can be reproduced by running GridSearch.DoubleCouple+Magnitude+Depth.py and GridSearch.DoubleCouple+Magnitude+Hypocenter.py.